Visualizing Graphs mit Graphviz (and LaTeX) – Part II
- Visualizing Graphs mit Graphviz (and LaTeX) – Part I
- Visualizing Graphs mit Graphviz (and LaTeX) – Part II
In this article I’d like to show a little bit about how to manipulate the style of the nodes and edges.
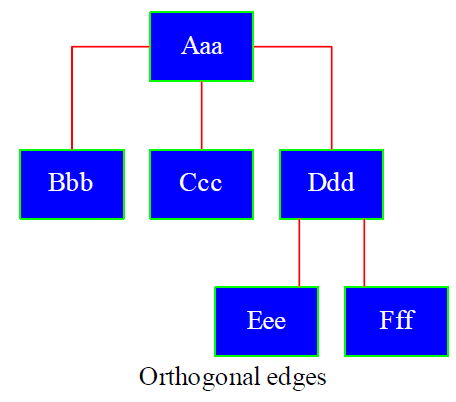
The graph uses orthogonal edges, red edges and green boxes with blue filling and white font color.
digraph G{
graph [label="Orthogonal edges", splines=ortho, nodesep=0.2]
node [shape=box,style=filled,fillcolor="#0000FF",color="#00FF00",fontcolor="#FFFFFF"];
edge[arrowhead="none",color="#FF0000"];
a [label="Aaa",URL="http://www.google.de"];
b [label="Bbb"];
c [label="Ccc"];
d [label="Ddd"];
e [label="Eee"];
f [label="Fff"];
a->b;
a->c;
a->d;
d->e;
d->f;
}
Note that the URL can only be used in the SVG version, the PDF representation does not support it.