2021-01-09, 20:37
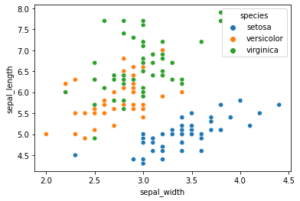
Hier ein einfaches Beispiel für einen Scatterplot mit Python und dem Seaborn Modul. Das Beispiel nutzt den bekannten Iris-Datensatz von R. Fisher, der gut für Klassifikationstechniken genutzt werden kann.
import seaborn as sns

iris=sns.load_dataset('iris')

sns.scatterplot(x=iris['sepal_width'],y=iris['sepal_length'],hue=iris['species']) |
import seaborn as sns
iris=sns.load_dataset('iris')
sns.scatterplot(x=iris['sepal_width'],y=iris['sepal_length'],hue=iris['species'])
Uwe Ziegenhagen likes LaTeX and Python, sometimes even combined.
Do you like my content and would like to thank me for it? Consider making a small donation to my local fablab, the Dingfabrik Köln. Details on how to donate can be found here Spenden für die Dingfabrik.
More Posts - Website
2016-02-03, 22:02
Hier meine Folien zum Data Science Meetup vom 29.01.2016.
Pandas (PDF)
Uwe Ziegenhagen likes LaTeX and Python, sometimes even combined.
Do you like my content and would like to thank me for it? Consider making a small donation to my local fablab, the Dingfabrik Köln. Details on how to donate can be found here Spenden für die Dingfabrik.
More Posts - Website