Author Archive

Creating Documents for Multiple Audiences (with the multiaudience package)

Boris Veytsman has recently published a new package to create output documents for multiple audiences in one single file.

The document creation process is divided into two steps: a) create the document and b) create the batch/bash file to automate the document creation.

Find below a sample document (save as ‚multdocument.tex‘) you can use as a starting point. As one can see, three audiences are defined here: „board“, „business“ and „tech“. The „shownto“ environment has one parameter, the comma-separated list of audiences, the content of the section shall be shown to. If the first item is a „-“ instead, the negates the meaning (so {-,board} means „show to every audience except the board). There are also commands for audience-specific footnotes or sections, check the manual for more information.

\begin{shownto}{board}
Some text for the board, for example an executive summary.
\end{shownto}

Remark 2015-08-17: With „tagging“ there is another package, that supports the creation of multiple editions in a single file.

\documentclass[12pt,english]{article}
\usepackage[utf8]{inputenc}
\usepackage[T1]{fontenc}
\usepackage{babel}
 
\usepackage{multiaudience}
 
\SetNewAudience{tech}
\SetNewAudience{business}
\SetNewAudience{board}
 
\begin{document}
 
This text is shown to everybody as it is outside any `multiaudience' environment
 
\begin{shownto}{board}
Some text for the board, for example an executive summary.
\end{shownto}
 
\begin{shownto}{tech,business}
Text for the tech department and the business users, for example a list of business requirements.
\end{shownto}
 
\begin{shownto}{-, board}
Text for every audience except the board.
\end{shownto}
 
Some text.\Footnote{board}{Some footnote just for the board}
 
 
\begin{Section}{board}[Short title]{Long Title of this Section}
 
Text in the section just for the board.
 
\end{Section}
 
 
\end{document}

After we have defined the document with the audiences we want to automate the PDF-creation process in which we tell LaTeX for which audience we want to create the document.

Since LaTeX can take definitions via LaTeX-commandline call, it’s quite easy to create a batch file with one line for each audience:

pdflatex -jobname file-board "\def\CurrentAudience{board}\input{multdocument}"
pdflatex -jobname file-tech "\def\CurrentAudience{tech}\input{multdocument}"
pdflatex -jobname file-business "\def\CurrentAudience{business}\input{multdocument}"

„-jobname“ defines the name of the PDF-file, the „\def{…}“ command sets the current audience. What you get when you run this batch is three different output files with just the information that shall be visible for each audience.


file-board

file-business

file-tech

Uwe

Uwe Ziegenhagen likes LaTeX and Python, sometimes even combined. Do you like my content and would like to thank me for it? Consider making a small donation to my local fablab, the Dingfabrik Köln. Details on how to donate can be found here Spenden für die Dingfabrik.

More Posts - Website

Subgraphs with Graphviz

Currently I am trying to find a way to visualize all BABoK inputs and outputs in one diagram. Graphviz is the way to go for this task. The following diagram is a simple example how to create different clusters of subgraphs and connecting them.

digraph g{
splines=ortho;
nodesep=1;
ranksep=1;
node [shape=box];
compound=true;

subgraph cluster0 {
  	node [shape=box]
	a23 [label="a"];
	b [label="b"];
	c [label="c\nTest"];
	label="INPUTS";
	graph[style=dotted];
}
subgraph cluster1 {
	d [label="d"];
	e [label="eee"];
	f [label="f\ng"];
	label="OUTPUTS";
	graph[style=dashed];
}

b -> f[ltail=cluster0,lhead=cluster1];
}

graph1

Uwe

Uwe Ziegenhagen likes LaTeX and Python, sometimes even combined. Do you like my content and would like to thank me for it? Consider making a small donation to my local fablab, the Dingfabrik Köln. Details on how to donate can be found here Spenden für die Dingfabrik.

More Posts - Website

Github Grundlagen

Der folgende Artikel ist eher als Gedankenstütze für mich zu verstehen, um die wesentlichen GitHub Befehle parat zu haben. Bisher habe ich nur auf Subversion gesetzt, Github bietet dies jedoch aus verständlichen Gründen nicht an. (Nachtrag: Subversion geht wohl doch: https://github.com/blog/966-improved-subversion-client-support)

Klonen eines Github Repositories auf die lokale Platte

https://github.com/UweZiegenhagen/Rcourse.git

Hinzufügen einer Datei zum Repository

git add 'Dateiname'

Übertragen auf den Github Server

git push

Uwe

Uwe Ziegenhagen likes LaTeX and Python, sometimes even combined. Do you like my content and would like to thank me for it? Consider making a small donation to my local fablab, the Dingfabrik Köln. Details on how to donate can be found here Spenden für die Dingfabrik.

More Posts - Website

Umzug von Google Code nach Github

Da Google leider sein Google Code Angebot einstellt, habe ich meine öffentlichen LaTeX Repositories nach Github umziehen lassen. In Zukunft werde ich sicher mehr öffentliche Repositories nutzen, um Präsentationen und Dokumente zu veröffentlichen.

Template für Business Requirements Documents

Von code.google.com/p/latex-business-requirements-documents nach https://github.com/UweZiegenhagen/latex-business-requirements-documents

LaTeX Thesis Template

Von code.google.com/p/latex-thesis-template nach https://github.com/UweZiegenhagen/latex-thesis-template

Vorlage für Spendenquittungen

Von code.google.com/p/spendenquittungen-mit-latex nach https://github.com/UweZiegenhagen/spendenquittungen-mit-latex

Uwe

Uwe Ziegenhagen likes LaTeX and Python, sometimes even combined. Do you like my content and would like to thank me for it? Consider making a small donation to my local fablab, the Dingfabrik Köln. Details on how to donate can be found here Spenden für die Dingfabrik.

More Posts - Website

Generating Tables of Contents with jQuery

For my FOM lecture on webprogramming I created a small jQuery example to automatically generate tables of contents. The following code just extracts h1-headings, using jQuery’s pseudoclasses („:header“) other extractions are of course possible.

Update 2015-06-21: I removed the ‚counter‘ variable, since ‚index‘ is already providing a counter.

<!DOCTYPE html>
<html>
<head>
	<meta charset="utf-8">
<script type="text/javascript" src="jquery-2.1.1.min.js"></script>
 
</head>
<body>
 
<div id="toc"></div>
 
<h1>1st Headline</h1>
<h2>1st Subheader</h2>
 
<p>Lorem ipsum dolor sit amet, consetetur sadipscing elitr, sed diam nonumy eirmod tempor invidunt ut labore et dolore magna aliquyam erat, sed diam voluptua. At vero eos et accusam et justo duo dolores et ea rebum. Stet clita kasd gubergren, no sea takimata sanctus est Lorem ipsum dolor sit amet.</p>
 
<h1>2nd Headline</h1>
<h2>2nd Subheader</h2>
 
<p>Lorem ipsum dolor sit amet, consetetur sadipscing elitr, sed diam nonumy eirmod tempor invidunt ut labore et dolore magna aliquyam erat, sed diam voluptua. At vero eos et accusam et justo duo dolores et ea rebum. Stet clita kasd gubergren, no sea takimata sanctus est Lorem ipsum dolor sit amet.</p>
 
<h1>3rd Headline</h1>
<h2>3rd Subheader</h2>
 
<p>Lorem ipsum dolor sit amet, consetetur sadipscing elitr, sed diam nonumy eirmod tempor invidunt ut labore et dolore magna aliquyam erat, sed diam voluptua. At vero eos et accusam et justo duo dolores et ea rebum. Stet clita kasd gubergren, no sea takimata sanctus est Lorem ipsum dolor sit amet.</p>
 
<script>
$(document).ready(function() {
	$("h1" ).each(function(index) {
		$(this).html($(this).html()+"<a name='lnk" + index +  "'></a>");
  	console.log(index + ": " + $(this).text());
  	$("#toc").html($("#toc").html() + "<br><a href='#lnk" + index + "'>" + $(this).text() + "</a>");
	});
}
);
</script>
 
</body>
</html>

autotoc

Uwe

Uwe Ziegenhagen likes LaTeX and Python, sometimes even combined. Do you like my content and would like to thank me for it? Consider making a small donation to my local fablab, the Dingfabrik Köln. Details on how to donate can be found here Spenden für die Dingfabrik.

More Posts - Website

Visualizing Graphs with GraphViz

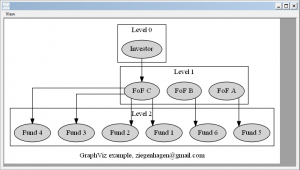
Here’s a nice example of GraphViz visualizing Fund structures.

digraph G {
graph [label="GraphViz example", splines=ortho, nodesep=0.2]
                subgraph cluster_ {
                                node [style=filled];
                                i0;
                                label = "Level 0";
                }
 
                subgraph cluster_0 {
                                node [style=filled];
                                a0  a1  a2;
                                label = "Level 1";
                }
 
                subgraph cluster_1 {
                                node [style=filled];
                                rank=same;
                                b0 b1 b2 b3 b4 b5;
                                label = "Level 2";
                }
                
                i0 [label="Investor"];
                a0 [label="FoF A"];
                a1 [label="FoF B"];
                a2 [label="FoF C"];
                b0 [label="Fund 1"];
                b1 [label="Fund 2"];
                b2 [label="Fund 3"];
                b3 [label="Fund 4"];
                b4 [label="Fund 5"];
                b5 [label="Fund 6"];
                
                i0->a2;
                a0->b4;
                a1->b5;
                a2->b0;
                a2->b1;
                a2->b2;
                a2->b3;
}

gv-01

Uwe

Uwe Ziegenhagen likes LaTeX and Python, sometimes even combined. Do you like my content and would like to thank me for it? Consider making a small donation to my local fablab, the Dingfabrik Köln. Details on how to donate can be found here Spenden für die Dingfabrik.

More Posts - Website

Embedding the TeX code in the PDF

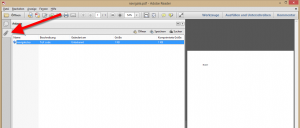
There are a few packages out there which allow the user to add arbitrary files to the PDF container. The following example uses the „navigator“ package by Paul Isambert.

\documentclass[12pt,ngerman]{scrartcl}
\usepackage[utf8]{inputenc}
\usepackage[T1]{fontenc}
\usepackage{babel}
\usepackage{navigator}
 
\begin{document}
 
Hallo!
 
\embeddedfile[TeX code]{\jobname}{\jobname.tex}
 
\end{document}

navi

Uwe

Uwe Ziegenhagen likes LaTeX and Python, sometimes even combined. Do you like my content and would like to thank me for it? Consider making a small donation to my local fablab, the Dingfabrik Köln. Details on how to donate can be found here Spenden für die Dingfabrik.

More Posts - Website

Stimmkarten mit LaTeX erstellen

Hier ein kleines Beispiel, wie man mit ticket.sty Stimmkarten für Vereinsversammlungen erstellen kann:

\documentclass[a4paper,12pt,ngerman]{scrartcl}
\usepackage[total={210mm,297mm},top=0mm,left=0mm, includefoot]{geometry}
\usepackage[badges]{ticket}
\usepackage{graphicx,palatino}
 
\usepackage{filecontents}
\begin{filecontents}{badges.tdf}
\unitlength=1mm
\hoffset=-5mm
\voffset=0mm
\ticketNumbers{1}{2}
\ticketSize{170}{120} % unitlength => mm
\ticketDistance{0}{0} % unitlength => mm
\end{filecontents}
 
\usepackage[utf8]{inputenc}
\usepackage[T1]{fontenc}
\usepackage{babel}
\usepackage{xcolor}
 
\renewcommand{\ticketdefault}{}%
\makeatletter
\@boxedtrue % Rahmen um Ticket
\@emptycrossmarkfalse % Falzmarken
\@cutmarktrue % Schnittmarken
\makeatother
 
\newcommand{\mylabel}[1]{
\ticket{%
\put(22,105){\Large \textit{Vereins-Mitgliedsversammlung September 2015}}
\put(30,55){\Huge\bfseries #1}
\put(67,15){\Large \textit{Stimmkarte}}
}}
 
\begin{document}
\mylabel{Max Mustermann}
\mylabel{Gabriele Musterfrau}
\end{document}

stimmkarten-01

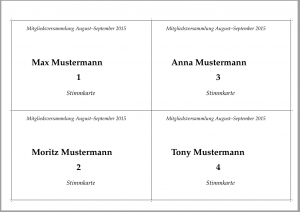
Durch einfaches Anpassen der badges.tdf (hier direkt im TeX-Dokument) kann man auch einfach 4-auf-1 Stimmkarten erstellen.

\documentclass[a4paper,12pt,ngerman]{scrartcl}
\usepackage[total={210mm,297mm},landscape,top=0mm,left=0mm, includefoot]{geometry}
\usepackage[badges]{ticket}
\usepackage{graphicx,palatino}
 
\usepackage{filecontents}
\begin{filecontents}{badges.tdf}
\unitlength=1mm
\hoffset=-15mm
\voffset=-10mm
\ticketNumbers{2}{2}
\ticketSize{140}{90} % unitlength => mm
\ticketDistance{0}{0} % unitlength => mm
\end{filecontents}
 
\usepackage[utf8]{inputenc}
\usepackage[T1]{fontenc}
\usepackage{babel}
 
\renewcommand{\ticketdefault}{}%
\makeatletter
\@boxedtrue % Rahmen um Ticket
\@emptycrossmarkfalse % Falzmarken
\@cutmarktrue % Schnittmarken
\makeatother
 
\newcommand{\mylabel}[2]{
\ticket{%
\put(15,80){\large \textit{Mitgliedsversammlung August--September 2015}}
\put(20,45){\Huge\bfseries #1}
\put(65,30){\Huge\bfseries #2}
\put(55,15){\Large \textit{Stimmkarte}}
}}
 
\begin{document}
\mylabel{Max Mustermann}{1}
\mylabel{Moritz Mustermann}{2}
\mylabel{Anna Mustermann}{3}
\mylabel{Tony Mustermann}{4}
\end{document}

stimmkarten-02

Uwe

Uwe Ziegenhagen likes LaTeX and Python, sometimes even combined. Do you like my content and would like to thank me for it? Consider making a small donation to my local fablab, the Dingfabrik Köln. Details on how to donate can be found here Spenden für die Dingfabrik.

More Posts - Website

Computing Confidence Intervals with R

To highlight how confidence intervals cover in 1-\alpha cases the true parameter I hacked together a little R code based on code from http://paleocave.sciencesortof.com/2013/03/writing-a-for-loop-in-r/ and http://www.cyclismo.org/tutorial/R/confidence.html

  • I define a function which takes as parameter „runs“ the number of confidence intervals to compute
  • result is the vector of results, it will contain TRUE values for those intervals that cover the true parameter and FALSE for those which don’t
  • for each run I draw a sample of 10000 points from N(0,1)
  • I then calculate the mean and standard deviation of the sample
  • before calculating the limits of the confidence interval, „left“ and „right“
  • Since I know the true mu is 0 I can check if 0 falls into this interval, the result of this check is stored in the i-th column of the result vector
  • finally I calculate the summary of the result vector. On average 95% percent of all intervals will cover the true mu, 0.

If I find some more time I will add some functionality to run this code on multiple cores as well as a graphical visualisation of the intervals.

confInt <- function(runs){
	result<-NULL
	for (i in 1:runs) {
		data<-rnorm(10000)
		n<-length(data)
		a<-mean(data)
		s<-sd(data)
		error <- qnorm(0.975)*s/sqrt(n)
		left <- a-error
		right <- a+error
		result[i] = left<0 & 0<right
	}
	result
}
summary(confInt(100))

EDIT: Using some more ggplot2 code I have the graphical visualization ready:

confInt <- function(runs){
	x<-1:runs
	mu<-NULL
	sigma<-NULL
	result<-NULL
	vleft<-NULL
	vright<-NULL
 
	for (i in 1:runs) {
		data<-rnorm(1000)
		n<-length(data)
		a<-mean(data)
		mu[i]<-a
		s<-sd(data)
		sigma[i]<-s
		error <- qnorm(0.975)*s/sqrt(n)
		left <- a-error
		right <- a+error
 
		result[i] = left<0 & 0<right
		vleft[i] = left	
		vright[i] = right
}
	data.frame(x,mu,sigma,result,vleft,vright)
}
 
 
df<-confInt(100)
 
require(ggplot2)
 
myplot<-ggplot(df, aes(x = x, y = mu)) +
  geom_point(size = 2) +
  geom_errorbar(aes(ymax = vleft, ymin = vright,colour=result*3))
myplot + theme_bw() 
summary(df)

See http://stackoverflow.com/questions/30289894/plotting-confidence-intervals-from-a-dataframe/30290123#30290123 for an alternative solution.

Uwe

Uwe Ziegenhagen likes LaTeX and Python, sometimes even combined. Do you like my content and would like to thank me for it? Consider making a small donation to my local fablab, the Dingfabrik Köln. Details on how to donate can be found here Spenden für die Dingfabrik.

More Posts - Website

Configuring the Samba server on the Bananapi

This entry is part 4 of 5 in the series Raspberry Cluster

Configuring the samba server and having it use the attached 2,5″ HDD was actually pretty easy.

Step 1: Mounting the harddisk

From http://mein.homelinux.com/wiki/linux/mounten I learnt how to add the attached harddisk to the fstab. blkid gave me the UUID of the disk (which I had previously partioned and formated with gparted), so I just had to a) create a directory /media/storage, b) set the access rights with chmod 777 /media/storage and add the following line to the fstab:

UUID=b06c9eb6-7cc3-429b-9176-44896e712319 /media/storage ext4 auto,defaults 0 2

Step 2: Installing samba

sudo apt-get install samba installed samba, but not smbpasswd. A quick sudo apt-get install samba-common-bin fixed this.

After I had created a „bananapi“ user on the machine I added this account to the list of samba users with the command smbpasswd -a bananapi. I then took the sample configuration for the /etc/samba/smb.conf from https://www.thomas-krenn.com/de/wiki/Einfache_Samba_Freigabe_unter_Debian and rebooted the machine.

From my Windows machine I can connect now to \\bananapiip\public and use it as a samba server. When copying a 1 GB iso image to the \public share I got an avaerage of 35 MB per second.

Remarks 2020-06-06:

[global]
workgroup = smb
security = user
map to guest = Bad Password

[homes]
comment = Home Directories
browsable = no
read only = no
create mode = 0750

[public]
# chmod -R 777 /home/uwe makes it publicly accessible
path = /home/uwe/
public = yes
writable = yes
comment = smb share
printable = no
guest ok = yes

Uwe

Uwe Ziegenhagen likes LaTeX and Python, sometimes even combined. Do you like my content and would like to thank me for it? Consider making a small donation to my local fablab, the Dingfabrik Köln. Details on how to donate can be found here Spenden für die Dingfabrik.

More Posts - Website