Archive for the ‘Python / SciPy / pandas’ Category.
2017-10-22, 20:06
Hier ein Python-Codeschnipsel, den man für eigene Logging-Projekte nutzen kann. Ziel ist es, die Logging-Informationen sowohl in eine Datei als auch nach stdout zu schreiben.
# -*- coding: utf-8 -*-

import logging # Logging
import time # Time
import sys


# Logger in Datei und auf die Konsole
logger = logging.getLogger("Logfile")
logger.propagate = False
logger.setLevel(logging.DEBUG)


fileHandler = logging.FileHandler(logger.name + ".log", mode='w')
fileHandler_format = logging.Formatter('%(asctime)s_%(levelname)s: %(message)s', datefmt='%H:%M:%S')
fileHandler.setFormatter(fileHandler_format)

consoleHandler = logging.StreamHandler(sys.stdout)

consoleHandler.setFormatter(fileHandler_format)

# Remove existing loggers
if logger.handlers:
    for handler in logger.handlers:
        logger.removeHandler(handler)

logger.addHandler(fileHandler)
logger.addHandler(consoleHandler)


logger.info('Hello')
logger.warning('World')
logger.error('Foobar')

logging.shutdown() |
# -*- coding: utf-8 -*-
import logging # Logging
import time # Time
import sys
# Logger in Datei und auf die Konsole
logger = logging.getLogger("Logfile")
logger.propagate = False
logger.setLevel(logging.DEBUG)
fileHandler = logging.FileHandler(logger.name + ".log", mode='w')
fileHandler_format = logging.Formatter('%(asctime)s_%(levelname)s: %(message)s', datefmt='%H:%M:%S')
fileHandler.setFormatter(fileHandler_format)
consoleHandler = logging.StreamHandler(sys.stdout)
consoleHandler.setFormatter(fileHandler_format)
# Remove existing loggers
if logger.handlers:
for handler in logger.handlers:
logger.removeHandler(handler)
logger.addHandler(fileHandler)
logger.addHandler(consoleHandler)
logger.info('Hello')
logger.warning('World')
logger.error('Foobar')
logging.shutdown()
Uwe Ziegenhagen likes LaTeX and Python, sometimes even combined.
Do you like my content and would like to thank me for it? Consider making a small donation to my local fablab, the Dingfabrik Köln. Details on how to donate can be found here Spenden für die Dingfabrik.
More Posts - Website
2017-10-08, 16:35
For months it has been quiet on this front, recently I have started again my efforts to have a working cluster of Raspberry PIs. I purchased a few Pi 3 (Cyberport offered them for 29,95 Euro a piece), a Logitech 8-port hub (from Pollin, around 10 Euro) that works with 5V and therefore should work by USB power. Right now I built the stack of PIs (4 Pi 2, 4 Pi 3) by connecting all of them using M2.5 nylon spacers from Banggood. As power supply I am using an Aukey PA-T8 USB charger with 10 3.0 USB ports that deliver 70W in total.

Uwe Ziegenhagen likes LaTeX and Python, sometimes even combined.
Do you like my content and would like to thank me for it? Consider making a small donation to my local fablab, the Dingfabrik Köln. Details on how to donate can be found here Spenden für die Dingfabrik.
More Posts - Website
2017-07-30, 18:04
Kürzlich musste ich XML-Tags aus XML-Dateien löschen, um die entsprechenden XML-Dateien etwas übersichtlicher zu gestalten. Der richtige Weg wäre sicher gewesen, einen XSLT-Prozessor zu nutzen, der die entsprechenden Tags ausfiltert, aber mangels Zeit habe ich dann doch ein kleines Python-Skript gebaut. Die zu entfernenden Tags hatten auch keine Properties und ließen sich daher gut entfernen.
def filter(oldfile, newfile, filterStart, filterEnd):
    killFlag = 0
    with open(newfile, 'w') as outfile, open(oldfile, 'r', encoding='utf-8') as infile:
        for line in infile:
            strIndex = line.find(filterStart)
            if (strIndex > -1) | (killFlag == 1):
                killFlag = 1
            else:
                outfile.write(line)
                strIndex2 = line.find(filterEnd)
                if (strIndex2 > -1):
                    killFlag = 0

filter('somexmlfile.xml', 'somefilteredxml.xml', '<xs:annotation>', '</xs:annotation>') |
def filter(oldfile, newfile, filterStart, filterEnd):
killFlag = 0
with open(newfile, 'w') as outfile, open(oldfile, 'r', encoding='utf-8') as infile:
for line in infile:
strIndex = line.find(filterStart)
if (strIndex > -1) | (killFlag == 1):
killFlag = 1
else:
outfile.write(line)
strIndex2 = line.find(filterEnd)
if (strIndex2 > -1):
killFlag = 0
filter('somexmlfile.xml', 'somefilteredxml.xml', '<xs:annotation>', '</xs:annotation>')
Uwe Ziegenhagen likes LaTeX and Python, sometimes even combined.
Do you like my content and would like to thank me for it? Consider making a small donation to my local fablab, the Dingfabrik Köln. Details on how to donate can be found here Spenden für die Dingfabrik.
More Posts - Website
2017-03-25, 08:09
One of the many approximations of Pi is the Gregory-Leibniz series (image source Wikipedia):

Here is an implementation in Python:
# -*- coding: utf-8 -*-
"""
Created on Sat Mar 25 06:52:11 2017
@author: Uwe Ziegenhagen
"""

sum = 0
factor = -1

for i in range(1, 640000, 2):
        sum = sum + factor * 1/i
        factor *= -1
        # print(sum)

print(-4*sum) |
# -*- coding: utf-8 -*-
"""
Created on Sat Mar 25 06:52:11 2017
@author: Uwe Ziegenhagen
"""
sum = 0
factor = -1
for i in range(1, 640000, 2):
sum = sum + factor * 1/i
factor *= -1
# print(sum)
print(-4*sum)
Uwe Ziegenhagen likes LaTeX and Python, sometimes even combined.
Do you like my content and would like to thank me for it? Consider making a small donation to my local fablab, the Dingfabrik Köln. Details on how to donate can be found here Spenden für die Dingfabrik.
More Posts - Website
2017-03-20, 20:14
Durch eine SX Frage bin ich auf das Verfahren der „Russischen Bauernmultiplikation“ gestoßen, mit der man ohne Multiplikation ganzzahlige Zahlen miteinander multiplizieren kann. Just for Fun hier die Python-Implementierung:
# -*- coding: utf-8 -*-
"""
Created on Sat Mar 18 10:04:40 2017

@author: Uwe Ziegenhagen
"""
import pandas as pd
from math import floor

def russianPeasantMultiply(a, b):
    assert a > 1
    assert b > 0
    data = pd.DataFrame([[a, b]], columns=list('ab'))
    while a > 1:
        a = floor(a/2)
        b = b + b
        data.loc[len(data)]=[a, b]
    data = data[data['a'] % 2 == 1]
    return(data.b.sum())

print(russianPeasantMultiply(63, 17)) |
# -*- coding: utf-8 -*-
"""
Created on Sat Mar 18 10:04:40 2017
@author: Uwe Ziegenhagen
"""
import pandas as pd
from math import floor
def russianPeasantMultiply(a, b):
assert a > 1
assert b > 0
data = pd.DataFrame([[a, b]], columns=list('ab'))
while a > 1:
a = floor(a/2)
b = b + b
data.loc[len(data)]=[a, b]
data = data[data['a'] % 2 == 1]
return(data.b.sum())
print(russianPeasantMultiply(63, 17))
Ohne pandas geht es sicher auch, aber pandas macht es etwas einfacher…
Uwe Ziegenhagen likes LaTeX and Python, sometimes even combined.
Do you like my content and would like to thank me for it? Consider making a small donation to my local fablab, the Dingfabrik Köln. Details on how to donate can be found here Spenden für die Dingfabrik.
More Posts - Website
2017-03-14, 07:59
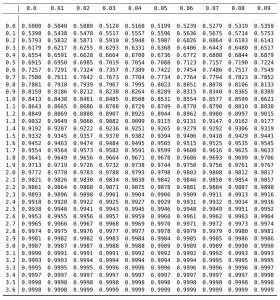
Here’s a simple example how one can generate a normal distribution table with Python and scipy so that it can be imported into LaTeX.
Example-03.zip
# -*- coding: utf-8 -*-
"""
Created on Mon Mar 13 21:14:17 2017
@author: Uwe Ziegenhagen, ziegenhagen@gmail.com

Creates a CDF table for the standard normal distribution

use booktabs package in the preamble and put
the generated numbers inside (use only one backslash!)

\\begin{tabular}{r|cccccccccc} \\toprule
<output here>
\\end{tabular}
"""

from scipy.stats import norm

print(norm.pdf(0))
print(norm.cdf(0),'\r\n')

horizontal = range(0,10,1)
vertikal = range(0,37)

header = ''
for i in horizontal:
    header = header + '& ' + str(i/100)

print(header, '\\\\ \\midrule')

for j in vertikal:
    x = j/10
    print('\\\\', x)
    for i in horizontal:
        y = x + i/100
        print('& ', "{:10.4f}".format(norm.cdf(y),4))


print('\\\\ \\bottomrule \r\n') |
# -*- coding: utf-8 -*-
"""
Created on Mon Mar 13 21:14:17 2017
@author: Uwe Ziegenhagen, ziegenhagen@gmail.com
Creates a CDF table for the standard normal distribution
use booktabs package in the preamble and put
the generated numbers inside (use only one backslash!)
\\begin{tabular}{r|cccccccccc} \\toprule
<output here>
\\end{tabular}
"""
from scipy.stats import norm
print(norm.pdf(0))
print(norm.cdf(0),'\r\n')
horizontal = range(0,10,1)
vertikal = range(0,37)
header = ''
for i in horizontal:
header = header + '& ' + str(i/100)
print(header, '\\\\ \\midrule')
for j in vertikal:
x = j/10
print('\\\\', x)
for i in horizontal:
y = x + i/100
print('& ', "{:10.4f}".format(norm.cdf(y),4))
print('\\\\ \\bottomrule \r\n')
Uwe Ziegenhagen likes LaTeX and Python, sometimes even combined.
Do you like my content and would like to thank me for it? Consider making a small donation to my local fablab, the Dingfabrik Köln. Details on how to donate can be found here Spenden für die Dingfabrik.
More Posts - Website
2017-03-12, 12:52
http://stackoverflow.com/questions/4485610/python-message-box-without-huge-library-dependancy zeigt, wie man Windows Standard-Dialoge (wie MessageBox und JaNeinAbbrechen) mit Python auswerten kann:
# using ctypes
import ctypes
MessageBox = ctypes.windll.user32.MessageBoxW
MessageBox(None, 'Hello World', 'This is the window title', 0)

# using win32ui
import win32ui
win32ui.MessageBox('This is the message', 'Window Title')

# using win32con
import win32con

result = win32ui.MessageBox('The Message', 'The Title', win32con.MB_YESNOCANCEL)

if result == win32con.IDYES:
    win32ui.MessageBox('You pressed "Yes"')
elif result == win32con.IDNO:
    win32ui.MessageBox('You pressed "No"')
elif result == win32con.IDCANCEL:
win32ui.MessageBox('You pressed "Cancel"') |
# using ctypes
import ctypes
MessageBox = ctypes.windll.user32.MessageBoxW
MessageBox(None, 'Hello World', 'This is the window title', 0)
# using win32ui
import win32ui
win32ui.MessageBox('This is the message', 'Window Title')
# using win32con
import win32con
result = win32ui.MessageBox('The Message', 'The Title', win32con.MB_YESNOCANCEL)
if result == win32con.IDYES:
win32ui.MessageBox('You pressed "Yes"')
elif result == win32con.IDNO:
win32ui.MessageBox('You pressed "No"')
elif result == win32con.IDCANCEL:
win32ui.MessageBox('You pressed "Cancel"')
Uwe Ziegenhagen likes LaTeX and Python, sometimes even combined.
Do you like my content and would like to thank me for it? Consider making a small donation to my local fablab, the Dingfabrik Köln. Details on how to donate can be found here Spenden für die Dingfabrik.
More Posts - Website
2017-03-12, 09:38
Hier ein kurzes Beispiel, wie man mittels melt bestimmte Daten in die richtige Form bekommt.
Ausgangspunkt ist der folgende Datensatz:
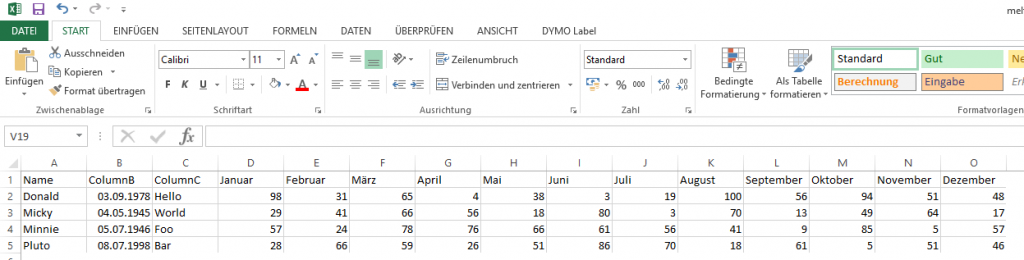
Zum Auswerten ist der nicht optimal, ich möchte die Monatswerte gern untereinander haben. Mittels melt geht das ganz einfach:
# -*- coding: utf-8 -*-

import pandas as pd

data = pd.read_excel('meltdata.xlsx')

print(data.shape[1], 'columns and', data.shape[0], 'rows')

print(list(data))

melted = pd.melt(data, id_vars=['Name', 'ColumnB', 'ColumnC'],
                 value_vars=['Januar', 'Februar', 'März', 'April', 'Mai',
                 'Juni', 'Juli', 'August', 'September', 'Oktober',
                 'November', 'Dezember'])

print(melted) |
# -*- coding: utf-8 -*-
import pandas as pd
data = pd.read_excel('meltdata.xlsx')
print(data.shape[1], 'columns and', data.shape[0], 'rows')
print(list(data))
melted = pd.melt(data, id_vars=['Name', 'ColumnB', 'ColumnC'],
value_vars=['Januar', 'Februar', 'März', 'April', 'Mai',
'Juni', 'Juli', 'August', 'September', 'Oktober',
'November', 'Dezember'])
print(melted)
      Name    ColumnB ColumnC   variable  value

0   Donald 1978-09-03   Hello     Januar     98

1    Micky 1945-05-04   World     Januar     29

2   Minnie 1946-07-05     Foo     Januar     57

3    Pluto 1998-07-08     Bar     Januar     28

4   Donald 1978-09-03   Hello    Februar     31

5    Micky 1945-05-04   World    Februar     41

6   Minnie 1946-07-05     Foo    Februar     24

...
Uwe Ziegenhagen likes LaTeX and Python, sometimes even combined.
Do you like my content and would like to thank me for it? Consider making a small donation to my local fablab, the Dingfabrik Köln. Details on how to donate can be found here Spenden für die Dingfabrik.
More Posts - Website
2016-10-15, 17:46
A while ago I thought about auto-documenting Python code, here’s what resulted from those experiments. (It’s far away from production quality, so use at your own risk)#
Let’s assume we have a Python file without docstrings:
class HalloWelt:

	def Hallo(welt):
		return welt


print(HalloWelt.Hallo("Welt")) |
class HalloWelt:
def Hallo(welt):
return welt
print(HalloWelt.Hallo("Welt"))
My experimental Python code:
import re

class Dokumenter:
	"""
	Fügt einer bestehenden Python-Datei Docstrings hinzu, falls keine vorhanden sind.
	"""

	def dokumentme(filename):
		print(">> Prüfe",filename,"auf Docstrings\n")

		with open(filename+"_bak", 'w') as outfile:
			with open(filename, 'r') as infile:
				rowIter= iter(infile)
				for row in rowIter:
					# schreibe die Zeile auf jeden Fall in die Zieldatei
					outfile.write(row)
					# Ist in der Zeile ein 'def ' vorhanden?
					if "def " in row:
						# suche erstes Zeichen, das kein Docstring ist
						index = re.search('\S', row).start()
						whitespace = row[:index]
						whitespaceLen = len(whitespace)
						if " " in whitespace:
							blanks = True
						else:
							blanks = False
						print(whitespaceLen,blanks)


						print(">> Funktionsdefinition gefunden")
						print(">> Schreibe Docstring")
						print(">> Whitespaces",index)
						outfile.write('"""\nHallo Welt\n"""\n')
					print(row)

Dokumenter.dokumentme("dokme.py")
# Tests, Datei mit und ohne Dokstring,unterschiedliche Einrückungstiefe
# extrahiere die Parameter |
import re
class Dokumenter:
"""
Fügt einer bestehenden Python-Datei Docstrings hinzu, falls keine vorhanden sind.
"""
def dokumentme(filename):
print(">> Prüfe",filename,"auf Docstrings\n")
with open(filename+"_bak", 'w') as outfile:
with open(filename, 'r') as infile:
rowIter= iter(infile)
for row in rowIter:
# schreibe die Zeile auf jeden Fall in die Zieldatei
outfile.write(row)
# Ist in der Zeile ein 'def ' vorhanden?
if "def " in row:
# suche erstes Zeichen, das kein Docstring ist
index = re.search('\S', row).start()
whitespace = row[:index]
whitespaceLen = len(whitespace)
if " " in whitespace:
blanks = True
else:
blanks = False
print(whitespaceLen,blanks)
print(">> Funktionsdefinition gefunden")
print(">> Schreibe Docstring")
print(">> Whitespaces",index)
outfile.write('"""\nHallo Welt\n"""\n')
print(row)
Dokumenter.dokumentme("dokme.py")
# Tests, Datei mit und ohne Dokstring,unterschiedliche Einrückungstiefe
# extrahiere die Parameter
Output:
class HalloWelt:

	def Hallo(welt):
"""
Hallo Welt
"""
		return welt


print(HalloWelt.Hallo("Welt")) |
class HalloWelt:
def Hallo(welt):
"""
Hallo Welt
"""
return welt
print(HalloWelt.Hallo("Welt"))
Uwe Ziegenhagen likes LaTeX and Python, sometimes even combined.
Do you like my content and would like to thank me for it? Consider making a small donation to my local fablab, the Dingfabrik Köln. Details on how to donate can be found here Spenden für die Dingfabrik.
More Posts - Website
2016-10-01, 11:12
Hier ein kurzer Code-Schnipsel (basierend auf https://www.tutorialspoint.com/python/os_walk.htm), der Verzeichnisse rekursiv durchläuft und jeweils den kompletten Pfad in einem pandas DataFrame speichert. Dateien werden ignoriert, dies kann durch die Überarbeitung des „pass“ Teils angepasst werden.
import os
import sys
import pandas as pd

paths = pd.DataFrame(columns={'Path'})

rootdir = 'somepath’

for root, directories, filenames in os.walk(rootdir):
    for directory in directories:
        paths = paths.append({'Path':(os.path.join(root, directory)).replace('\\','/')},ignore_index=True)
    for filename in filenames:
        pass

paths.to_clipboard() |
import os
import sys
import pandas as pd
paths = pd.DataFrame(columns={'Path'})
rootdir = 'somepath’
for root, directories, filenames in os.walk(rootdir):
for directory in directories:
paths = paths.append({'Path':(os.path.join(root, directory)).replace('\\','/')},ignore_index=True)
for filename in filenames:
pass
paths.to_clipboard()
Uwe Ziegenhagen likes LaTeX and Python, sometimes even combined.
Do you like my content and would like to thank me for it? Consider making a small donation to my local fablab, the Dingfabrik Köln. Details on how to donate can be found here Spenden für die Dingfabrik.
More Posts - Website