Archive for the ‘Programmierung’ Category.

Emacs: Encoding resetten

In der letzten Zeit hatte ich öfter das Problem, dass Emacs meine org-mode Datei mit dem falschen Encoding öffnet und alle Umlaute kaputt sind. Die Lösung findet sich auf Superuser:

M-x revert-buffer-with-coding-system

M-x set-buffer-file-coding-system

Ergänzung: Ich habe meine .emacs Datei wie folgt erweitert:

;; UTF-8 as default encoding
(set-language-environment "UTF-8")

Uwe

Uwe Ziegenhagen likes LaTeX and Python, sometimes even combined. Do you like my content and would like to thank me for it? Consider making a small donation to my local fablab, the Dingfabrik Köln. Details on how to donate can be found here Spenden für die Dingfabrik.

More Posts - Website
Creating Powerpoint Decks with Powershell

A couple days ago I would have been happy to have an automated way of creating Powerpoint slides (Powerpoint was not my choice anyway) now I found one with the help of the Scripting Guy and StackOverflow. The following code just opens Powerpoint and adds a couple slides, each with a different layout. I am not sure (resp. too lazy to check) how many layouts there are but it must be more than 30.

Clear-Host
Add-type -AssemblyName office
$application = New-Object -ComObject powerpoint.application
$application.visible = [Microsoft.Office.Core.MsoTriState]::msoTrue
$presentation = $application.Presentations.add()
 
$slide = $Presentation.Slides.Add($presentation.Slides.Count + 1, 1) # title slide
$slide = $Presentation.Slides.Add($presentation.Slides.Count + 1, 2) # slide title and text
$slide = $Presentation.Slides.Add($presentation.Slides.Count + 1, 3)
$slide = $Presentation.Slides.Add($presentation.Slides.Count + 1, 4)
$slide = $Presentation.Slides.Add($presentation.Slides.Count + 1, 5)
$slide = $Presentation.Slides.Add($presentation.Slides.Count + 1, 6)
$slide = $Presentation.Slides.Add($presentation.Slides.Count + 1, 7)
$slide = $Presentation.Slides.Add($presentation.Slides.Count + 1, 8)
$slide = $Presentation.Slides.Add($presentation.Slides.Count + 1, 9)
$slide = $Presentation.Slides.Add($presentation.Slides.Count + 1, 10)
$slide = $Presentation.Slides.Add($presentation.Slides.Count + 1, 11) # just slide title
$slide.Shapes.title.TextFrame.TextRange.Text = "This is the slide title"
$slide = $Presentation.Slides.Add($presentation.Slides.Count + 1, 12) # blank

Uwe

Uwe Ziegenhagen likes LaTeX and Python, sometimes even combined. Do you like my content and would like to thank me for it? Consider making a small donation to my local fablab, the Dingfabrik Köln. Details on how to donate can be found here Spenden für die Dingfabrik.

More Posts - Website

Excel Keyboard Shortcuts

A PDF with the most important Excel shortcuts: http://www.thecompanyrocks.com/wp-content/uploads/2011/02/CR-Updated-Chart-of-Popular-Excel-Keyboard-Shortcuts.pdf

Uwe

Uwe Ziegenhagen likes LaTeX and Python, sometimes even combined. Do you like my content and would like to thank me for it? Consider making a small donation to my local fablab, the Dingfabrik Köln. Details on how to donate can be found here Spenden für die Dingfabrik.

More Posts - Website

Finding truly empty folders with Powershell

The easiest approach to find empty folders with Powershell could be:

(gci C:\Scripts -r | ? {$_.PSIsContainer -eq $True}) | ? {$_.GetFiles().Count -eq 0} | select FullName

however this just finds the folders which have no files in them. To find truly empty folders – the one which also have no subfolders – use the following:

(gci C:\Scripts -r | ? {$_.PSIsContainer -eq $True}) | ?{$_.GetFileSystemInfos().Count -eq 0} | select FullName

Source: http://superuser.com/questions/321231/how-to-find-empty-directories-in-windows-using-a-powershell-script

Uwe

Uwe Ziegenhagen likes LaTeX and Python, sometimes even combined. Do you like my content and would like to thank me for it? Consider making a small donation to my local fablab, the Dingfabrik Köln. Details on how to donate can be found here Spenden für die Dingfabrik.

More Posts - Website

Subgraphs with Graphviz

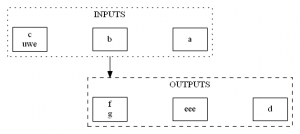
Currently I am trying to find a way to visualize all BABoK inputs and outputs in one diagram. Graphviz is the way to go for this task. The following diagram is a simple example how to create different clusters of subgraphs and connecting them.

digraph g{
splines=ortho;
nodesep=1;
ranksep=1;
node [shape=box];
compound=true;

subgraph cluster0 {
  	node [shape=box]
	a23 [label="a"];
	b [label="b"];
	c [label="c\nTest"];
	label="INPUTS";
	graph[style=dotted];
}
subgraph cluster1 {
	d [label="d"];
	e [label="eee"];
	f [label="f\ng"];
	label="OUTPUTS";
	graph[style=dashed];
}

b -> f[ltail=cluster0,lhead=cluster1];
}

graph1

Uwe

Uwe Ziegenhagen likes LaTeX and Python, sometimes even combined. Do you like my content and would like to thank me for it? Consider making a small donation to my local fablab, the Dingfabrik Köln. Details on how to donate can be found here Spenden für die Dingfabrik.

More Posts - Website

Github Grundlagen

Der folgende Artikel ist eher als Gedankenstütze für mich zu verstehen, um die wesentlichen GitHub Befehle parat zu haben. Bisher habe ich nur auf Subversion gesetzt, Github bietet dies jedoch aus verständlichen Gründen nicht an. (Nachtrag: Subversion geht wohl doch: https://github.com/blog/966-improved-subversion-client-support)

Klonen eines Github Repositories auf die lokale Platte

https://github.com/UweZiegenhagen/Rcourse.git

Hinzufügen einer Datei zum Repository

git add 'Dateiname'

Übertragen auf den Github Server

git push

Uwe

Uwe Ziegenhagen likes LaTeX and Python, sometimes even combined. Do you like my content and would like to thank me for it? Consider making a small donation to my local fablab, the Dingfabrik Köln. Details on how to donate can be found here Spenden für die Dingfabrik.

More Posts - Website

Computing Confidence Intervals with R

To highlight how confidence intervals cover in 1-\alpha cases the true parameter I hacked together a little R code based on code from http://paleocave.sciencesortof.com/2013/03/writing-a-for-loop-in-r/ and http://www.cyclismo.org/tutorial/R/confidence.html

  • I define a function which takes as parameter „runs“ the number of confidence intervals to compute
  • result is the vector of results, it will contain TRUE values for those intervals that cover the true parameter and FALSE for those which don’t
  • for each run I draw a sample of 10000 points from N(0,1)
  • I then calculate the mean and standard deviation of the sample
  • before calculating the limits of the confidence interval, „left“ and „right“
  • Since I know the true mu is 0 I can check if 0 falls into this interval, the result of this check is stored in the i-th column of the result vector
  • finally I calculate the summary of the result vector. On average 95% percent of all intervals will cover the true mu, 0.

If I find some more time I will add some functionality to run this code on multiple cores as well as a graphical visualisation of the intervals.

confInt <- function(runs){
	result<-NULL
	for (i in 1:runs) {
		data<-rnorm(10000)
		n<-length(data)
		a<-mean(data)
		s<-sd(data)
		error <- qnorm(0.975)*s/sqrt(n)
		left <- a-error
		right <- a+error
		result[i] = left<0 & 0<right
	}
	result
}
summary(confInt(100))

EDIT: Using some more ggplot2 code I have the graphical visualization ready:

confInt <- function(runs){
	x<-1:runs
	mu<-NULL
	sigma<-NULL
	result<-NULL
	vleft<-NULL
	vright<-NULL
 
	for (i in 1:runs) {
		data<-rnorm(1000)
		n<-length(data)
		a<-mean(data)
		mu[i]<-a
		s<-sd(data)
		sigma[i]<-s
		error <- qnorm(0.975)*s/sqrt(n)
		left <- a-error
		right <- a+error
 
		result[i] = left<0 & 0<right
		vleft[i] = left	
		vright[i] = right
}
	data.frame(x,mu,sigma,result,vleft,vright)
}
 
 
df<-confInt(100)
 
require(ggplot2)
 
myplot<-ggplot(df, aes(x = x, y = mu)) +
  geom_point(size = 2) +
  geom_errorbar(aes(ymax = vleft, ymin = vright,colour=result*3))
myplot + theme_bw() 
summary(df)

See http://stackoverflow.com/questions/30289894/plotting-confidence-intervals-from-a-dataframe/30290123#30290123 for an alternative solution.

Uwe

Uwe Ziegenhagen likes LaTeX and Python, sometimes even combined. Do you like my content and would like to thank me for it? Consider making a small donation to my local fablab, the Dingfabrik Köln. Details on how to donate can be found here Spenden für die Dingfabrik.

More Posts - Website

Building a Raspberry Pi 2cluster

This entry is part 1 of 5 in the series Raspberry Cluster

Big Data, Hadoop, NumPy, R cluster computing etc. are pretty hot topics. To get my hands on them and get a deeper understanding I have decided to build my own cluster out of small Raspberry Pi 2 computers. I am not the first one to come up with this idea, you can find a few nice examples online.

I have decided to use five Raspberry Pi 2 and one Banana Pi in this cluster. The Banana Pi has the advantage of being equipped with a Serial ATA port, my plan is to use it to store the data the Raspberries are working on.

The general setup is the following:

  1. 5 x Raspberry Pi 2 from Pollin for 37.95 Euro each
  2. A TP-Link 8-Port Gigabit Switch for 20.99 Euro
  3. a 6-Port RAVpower USB power source (3 x 1.0 Amp, 3 x 2.4 Amp) for 17.99 Euro
  4. a couple of five micro USB cables for 12.99 Euro
  5. Identical 16 GB micro-SD cards from Sandisk, Class 10 for 10.99 each
  6. the Banana Pi (I got mine from notebooksbilliger.de for 33.89 Euro)
  7. a SATA Power/Data cable to connect a 2.5″ harddisk to the Banana Pi

So altogether I spent around 320 for the electronic parts, some other parts (like SD card and USB cable for the Banana Pi) I had in my stash.

In the next article of this series I’ll describe the case I am currently building out of Lego Technics parts…

Uwe

Uwe Ziegenhagen likes LaTeX and Python, sometimes even combined. Do you like my content and would like to thank me for it? Consider making a small donation to my local fablab, the Dingfabrik Köln. Details on how to donate can be found here Spenden für die Dingfabrik.

More Posts - Website

Excel Funktion zum Zerlegen eines Strings

Die folgende Excel-Funktion ist nützlich, um innerhalb von Excel Strings in ihre Bestandteile zu zerlegen.


Function SplitteString(zeichenkette, separator, vorkommen) As String
Dim feld() As String
feld = Split(zeichenkette, separator)
SplitteString = feld(vorkommen - 1)
End Function

split

Uwe

Uwe Ziegenhagen likes LaTeX and Python, sometimes even combined. Do you like my content and would like to thank me for it? Consider making a small donation to my local fablab, the Dingfabrik Köln. Details on how to donate can be found here Spenden für die Dingfabrik.

More Posts - Website

Buchkritik: „JavaScript & jQuery: The Missing Manual“ von David Sawyer McFarland

Wie einige Leser meines Blogs möglicherweise wissen, unterrichte ich auch an der FOM hier in Köln. Für die Vorlesung zu „Web Programmierung“ hatte ich noch ein Buch gesucht, das die Grundlagen zu JavaScript/jQuery gut vermittelt. Über einen Kontakt der Kölner Python-Usergroup (vielen Dank auch dorthin) habe ich dann vom O’Reilly Verlag freundlicherweise ein Rezensionsexemplar der mittlerweile dritten Ausgabe von „JavaScript & jQuery: The Missing Manual“ erhalten, die ich hier kurz besprechen möchte.

Das Buch gliedert sich in sechs Teile:

  1. Getting Started with JavaScript
  2. Getting Started with jQuery
  3. Getting Started with jQuery UI
  4. Advanced jQuery and JavaScript
  5. Tips, Tricks, and Troubleshooting
  6. Appendix

Das Buch geht (zu Recht) davon aus, dass man grundlegende HTML-Kenntnisse hat. Am Anfang wird zwar kurz über HTML-Tags gesprochen — auch CSS wird kurz erwähnt — dann geht es aber los mit der JavaScript Programmierung. Nach dem obligatorischen „Hello World“ bekommt man die grammatikalischen Grundlagen der Sprache nähergebracht und welche Datentypen und Schlüsselwörter es gibt. Sehr ausführlich ist auch die Beschreibung von Flusssteuerung und Schleifen.

Im zweiten Teil startet man dann mit jQuery. Im direkten Vergleich mit JavaScript merkt man als Leser schnell, dass die Nutzung von jQuery doch einige Vorteile hat. Was in reinem JavaScript mühsame Konstrukte erfordert, ist in jQuery meist in einer kurzen Zeile erledigt. Der Autor zeigt hier auch sehr ausführlich, wie man Elemente in jQuery selektieren und auswerten kann. In Kapitel 5 geht es dann um die Behandlung von Events, in Kapitel 6 um die Steuerung von Animationen mittels jQuery.

Kapitel 7 vermittelt, wie häufig vorkommende Aufgaben wie das Austauschen von Bildern in jQuery schnell & einfach gelöst werden können, Kapitel 8 geht auf die Nutzung von jQuery in Web-Formularen ein.

Der dritte Teil ab Kapitel 9 behandelt jQuery UI, ein Thema, das ich aus Zeitmangel in der Vorlesung nur am Rande behandeln konnte. Der Autor zeigt hier, wie man die verschiedenen Komponenten aus dem jQuery UI Paket nutzt und wie man das gewonnene Wissen nutzen kann, um eine TODO-Listen Anwendung zu schreiben.

Fazit

Auf über 650 Seiten und bei einem aktuellen Preis von etwas mehr als 30 Euro bietet dieses Buch einen sehr guten und umfassenden Einstieg in das Thema. Ich konnte eine ganze Reihe von Inhalten — auch in Bezug auf die Vermittlung des Wissens — direkt in der Vorlesung einsetzen. Ich empfehle dieses Buch auch meinen Studenten, wenn sie mehr wissen wollen zu JavaScript & jQuery.

Uwe

Uwe Ziegenhagen likes LaTeX and Python, sometimes even combined. Do you like my content and would like to thank me for it? Consider making a small donation to my local fablab, the Dingfabrik Köln. Details on how to donate can be found here Spenden für die Dingfabrik.

More Posts - Website