2021-12-23, 20:35
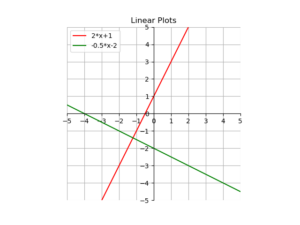
Hier ein kurzes Beispiel, wie man mit matplotlib Funktionen plotten kann.
import matplotlib.pyplot as plt
import numpy as np

ax = plt.gca()
plt.gca().set_aspect('equal')

ax.set_xticks(range(-6,6,1))
ax.set_yticks(range(-6,6,1))
ax.set_xlim([-5, 5])
ax.set_ylim([-5, 5])

ax.spines['top'].set_color('none')
ax.spines['bottom'].set_position('zero')
ax.spines['left'].set_position('zero')
ax.spines['right'].set_color('none')

x = np.linspace(-5,5,100)
y = 2*x+1
y2 = -0.5*x-2

plt.plot(x, y,  'r', label='2*x+1')
plt.plot(x, y2, 'g', label='-0.5*x-2')

plt.title('Linear Plots')

plt.legend(loc='upper left')

plt.grid()
plt.show() |
import matplotlib.pyplot as plt
import numpy as np
ax = plt.gca()
plt.gca().set_aspect('equal')
ax.set_xticks(range(-6,6,1))
ax.set_yticks(range(-6,6,1))
ax.set_xlim([-5, 5])
ax.set_ylim([-5, 5])
ax.spines['top'].set_color('none')
ax.spines['bottom'].set_position('zero')
ax.spines['left'].set_position('zero')
ax.spines['right'].set_color('none')
x = np.linspace(-5,5,100)
y = 2*x+1
y2 = -0.5*x-2
plt.plot(x, y, 'r', label='2*x+1')
plt.plot(x, y2, 'g', label='-0.5*x-2')
plt.title('Linear Plots')
plt.legend(loc='upper left')
plt.grid()
plt.show()
Uwe Ziegenhagen likes LaTeX and Python, sometimes even combined.
Do you like my content and would like to thank me for it? Consider making a small donation to my local fablab, the Dingfabrik Köln. Details on how to donate can be found here Spenden für die Dingfabrik.
More Posts - Website
2021-01-17, 11:58
Hier ein Beispiel, wie man Bilder für eine Animation mit matplotlib erstellen kann, adaptiert von im Netz gefundenen Code
Der folgende Python-Code erzeugt 720 einzelne Bilder und legt diese im Dateisystem ab. Mittels magick -quality 100 *.png outputfile.mpeg werden dann die Bilder zu einem MPEG-Video kombiniert. Hinweis: Nur unter Windows heißt der Befehl „magick“ da „convert“ auch ein Systemprogramm ist.
import matplotlib.pyplot as plt
import pandas as pd
import seaborn as sns
from mpl_toolkits.mplot3d import Axes3D

df = sns.load_dataset('iris')
sns.set(style = "darkgrid")

fig = plt.figure()
fig.set_size_inches(16, 9)

ax = fig.add_subplot(111, projection = '3d')

x = df['sepal_width']
y = df['sepal_length']
z = df['petal_width']

ax.set_xlabel("sepal_width")
ax.set_ylabel("sepal_lesngth")
ax.set_zlabel("petal_width")

c = {'setosa':'red', 'versicolor':'blue', 'virginica':'green'}

ax.scatter(x, y, z,c=df['species'].apply(lambda x: c[x]))

for angle in range(0, 720):
    ax.view_init((angle+1)/10, angle)
    plt.draw()
    plt.savefig('r:/'+str(angle).zfill(3)+'.png')
Eine kürzere Version der Animation habe ich unter https://www.youtube.com/watch?v=gdgvXpq4k1w abgelegt.
Hinweise zu anderen Konvertierungsprogrammen gibt es unter anderem hier: https://www.andrewnoske.com/wiki/Convert_an_image_sequence_to_a_movie
Uwe Ziegenhagen likes LaTeX and Python, sometimes even combined.
Do you like my content and would like to thank me for it? Consider making a small donation to my local fablab, the Dingfabrik Köln. Details on how to donate can be found here Spenden für die Dingfabrik.
More Posts - Website